Yellow Table
15
april 2014
international
construction
NEWSREPORT
Equipment top 50
The slowdown in
China, difficulties in the
mining industry and
the depreciation of the
Yen led to a reshuffle in
the global construction
equipment industry last year.
R
evenues for the world’s 50 largest
construction equipment manufacturers
fell -10% last year to US$ 163 billion,
as a variety of factors impacted on this cyclical
industry.
The most profound came from a downturn in
theglobalmining industry,whichpulledrevenues
down for equipment manufacturers around the
world. Although the Yellow Table attempts to
measure revenues from construction equipment
sales, and excludes companies that serve only the
mining industry, it is inevitable that a downturn
inminingwill impact onmany of the companies
in the league table. This is due to the blurred
margins between the two industries and thewide
varietyof different equipment used formining in
different parts of theworld.
For example, it was the downturn in mining
that was the main driver for the near US$ 10
billion decline in first-placed manufacturer
Caterpillar’s equipment revenues in 2013,
compared to 2012. Indeed, this was a factor for
all of the lone-line manufacturers in the top 10,
all of which saw their revenues decline inDollar
terms last year.
However, the greatest impact from the
downturn inmining last year was felt by drilling
equipment specialist Boart Longyear, which fell
eight places from its position in 2012 to no. 49
in this year’s ranking.
But aside from this decline for a heavily
mining-dependent manufacturer, the downturn
seems to have hit companies in the broad
earthmoving equipment industry harder than
manufacturers in niche areas. As well as seeing a
fall in revenues in 2013 – the year that rankings
in this year’s Yellow Table are based on – half
of the companies in the top 10 have seen their
share of total revenues decline since last year’s
study. For example, Caterpillar’s share is down
to 19.0%, compared to 21.8% in last year’s
YellowTable, Komatsu has fallen to 10.8% from
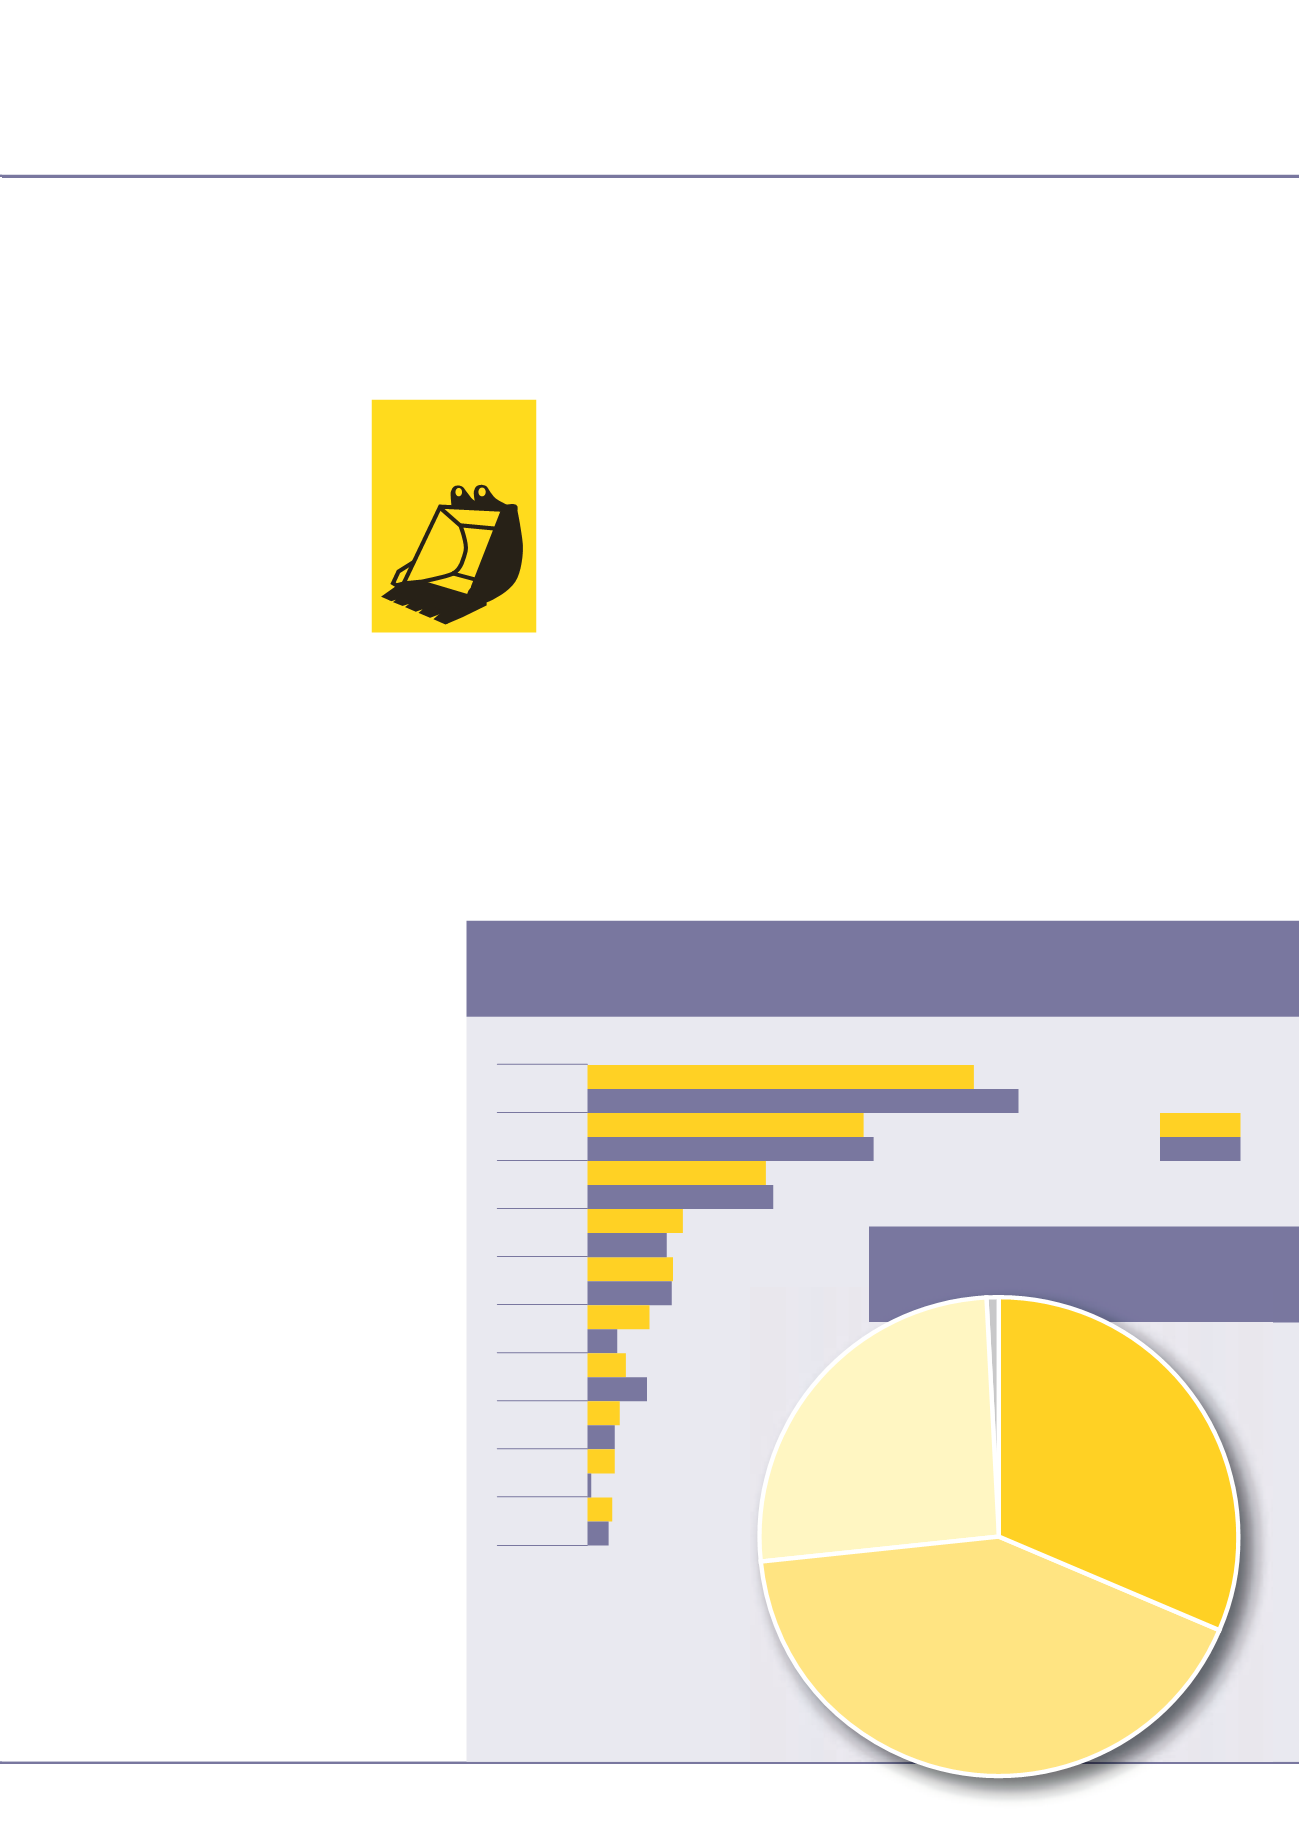
By country
By region
US
Japan
China
Germany
Sweden
SouthKorea
Finland
UK
Italy
France
34.8%
31.2%
22.3%
23.1%
14.4%
15%
6.9%
6.8%
7.7%
6.4%
5.0%
2.4%
3.2%
4.9%
2.6%
2.2%
2.2%
2.0%
0.3%
1.7%
This year
Last year
11.3%. Hitachi, Zoomlion and Sany
also saw their shares fall.
Despite some small gains for the
other five companies in the top 10,
the net result was that these large
companies accounted for 62.8% of
the top 50’s revenues in this year’s
study, compared to 66.5% in last
year’s edition of the Yellow Table.
This was the lowest the proportion
has been since 2010, when a surge
for several mid-sized Chinese manufacturers
squeezed themarket shares of the larger players.
The Chinese market also had a part to play in
this year’s edition of the YellowTable, with the
country’s continued slowdown in construction
and the high population of young machines
available from the 2009/10 stimulus boom
depressing revenues for domesticmanufacturers.
This saw the likes of Zoomlion and Sany lose
places within the top 10, and Lonking, XGMA
andChenggong also fall further down the table.
However, XCMG, Liugong and Sunward held
their ground, while Shantui moved up two
places.
But the net result was that the share of the top
50’s revenues claimed byChinesemanufacturers
fell to 14.4% in this year’s Yellow Table,
compared to 15.0% last year and a high-tide
mark of 16.9% in the 2012 edition, based on
2011 revenues.
In absolute terms, the Chinese manufacturers
in the Yellow Table had total revenues of
US$ 23.5 billion last year, compared to US$
30.6 billion at the peak – about a -23% decline
in the space of two years.
Currency effects
Another key factor in this year’sYellowTablewas
the depreciation of the Japanese Yen over the
course of 2013. In calculating revenues in US
Dollars for the YellowTable,
iC
uses the average
PERCENTAGE SHARE
>
YELLOW
TABLE
NorthAmerica
31.5%
Europe
26.0%
Asia
41.9%
RoW
0.6%


