Top 10
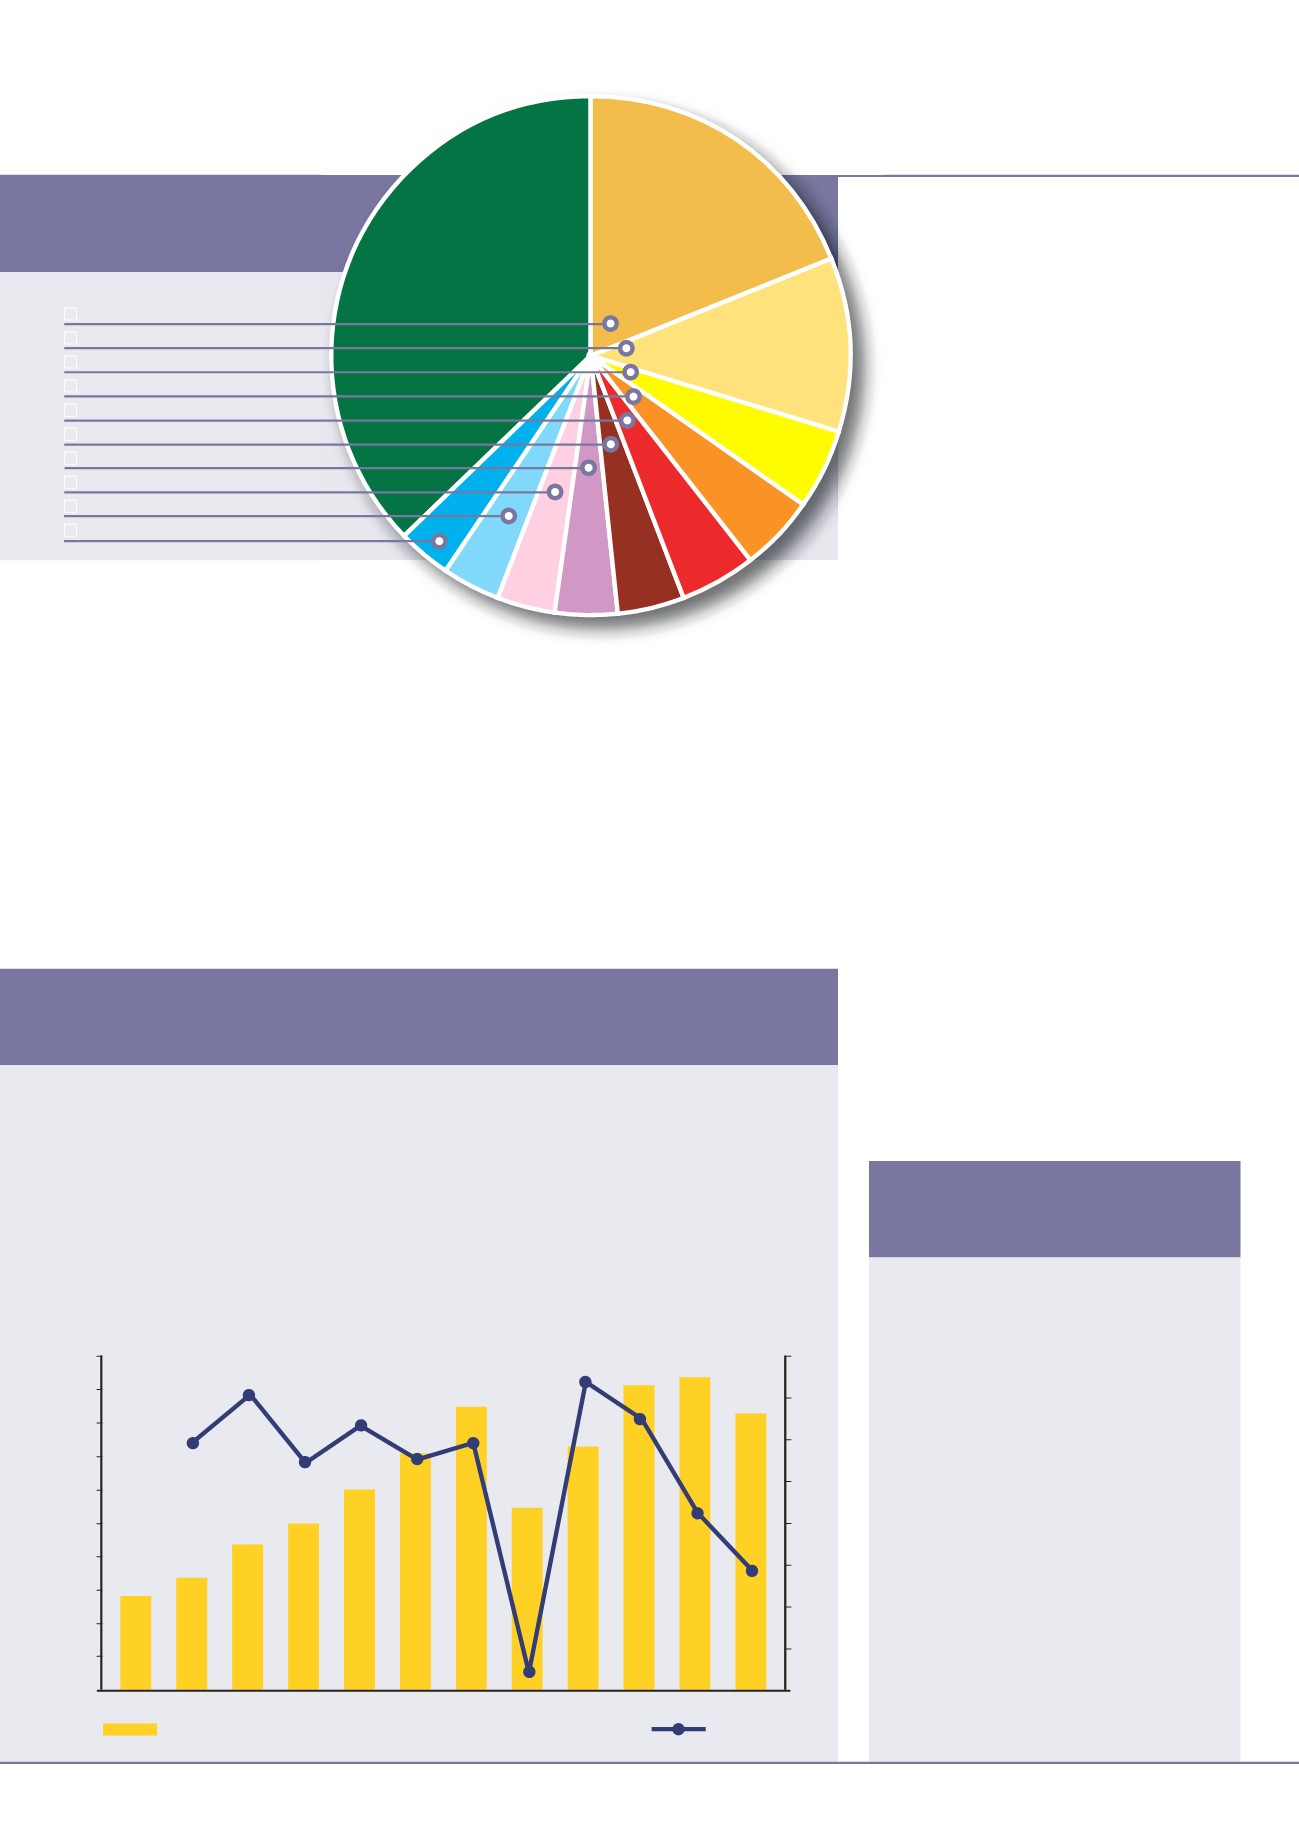
Company shares
international
construction
april 2014
NEWSREPORT
18
Yellow Table
Positions in the YellowTable are based on sales in
the2013 calendar year inUSDollars. Currencies
have been converted toDollars based on the
average exchange rate over the course of 2013.
Datawas gathered from a variety of sources
including audited accounts, company statements
and reputable third-party sources.
In Japan, India and certain other countries, the
use of the fiscal year (endingMarch31
st
) hasmade
it impossible to establish calendar year information.
In these cases, fiscal year resultswere used. In
some cases
iC
hasmade an estimate of revenues
based onhistorical data and industry trends.While
every effort has been taken to ensure information
in this report is accurate,
iC
does not accept any
liability for errors or omissions.
If youwould like to comment on the YellowTable,
or feel your company shouldbe included, please
e-mail the editor at
Methodology
US$ 21.0 billion in last year’s Yellow Table to
US$ 17.6 billion this year – a -16% decline.
Similar effects came into play for other
Japanese manufacturers in the Yellow Table,
and contributed to slides down the rankings
for Hitachi, Kobelco, Tadano and Furukawa.
Although other Japanese manufacturers held
their ground, or even gained a few places in
Kubota’s case, the net result was that their share
of total revenues fell from 23.1% in 2012 to
22.4% in this year’s YellowTable.
The decline in share and absolute revenues
among Chinese and Japanese manufacturers
last year, combined with Caterpillar’s big drop
in sales had a positive impact for the European
companies in the Yellow Table. They saw their
share of the top50’s revenues rise from21.1% in
last year’s edition to 26.0% this year.
However, this was asmore todowith technical
points about how the YellowTable is compiled
than a sudden surge in revenues.
Thefirstpoint is thatCNHhasbeen reclassified
as an Italian company in this year’s YellowTable,
following its incorporation with Fiat Industrial
into a new Italian entity, CNH Industrial. The
previous classification as a US company was
always open to some debate, and
iC
feels the
company is nowmost accurately identified as an
Italian business, following the corporate change.
In terms of the YellowTable, this has effectively
shifted 2.0% of total revenues from the US to
Europe.
Other changes in favour of the European share
are the addition of Sennebogen andHiab to the
ranking this year, two companies for which data
has newly become available. They add a further
1.0% of the top 50 revenues to the European
total.
So of the 4.9 percentage points that have been
added to the European share in the last year, 3.0
could be attributed to technical factors and 1.9
to a like-for-like revenue increase.
But the revenue increase was still useful in
terms of European companies’ placings. Both
Volvo and Liebherr moved up within the top
10, and JCB also did well to gain two places at
no. 12. Further down the table, other European
gainers included Wacker Neuson, Fayat and
Haulotte.What’smore, there were no disastrous
declines – no European company fell more than
two places in this year’s YellowTable.
iC
■
Caterpillar 19.0%
■
Komatsu 10.8%
■
Volvo 5.0%
■
Hitachi 4.9%
■
Liebherr 4.6%
■
Terex 4.3%
■
Zoomliom 3.7%
■
Sany 3.7%
■
JohnDeere 3.6%
■
Doosan 3.2%
T
he construction equipment business is a classically cyclical industry, with revenues boomingwhen
economic growth is strong and falling steeplywhen activity slows. The cycle has historically been
about five to seven years of growth followed by a two-year, or so, downturn period.
This looked like the case in the2000’s, with a longperiod of stronggrowth from2003 to2008 ending in
the sharp crash of the global economic crisis, which saw revenues in the industry fall nearly -40% in2009.
In2010 and2011 there seemed to be an equally sharp rebound, but last year’s YellowTable study showed
revenues stagnated in2012, and this year’s study points to a -10%decline.
Propsects for 2014 remain to be seen. There are positive signs in themarket and there is optimism about
growth inNorthAmerica inparticular. But as ever, timewill tell.
Equipment industry cycles
Last year’s downturn in revenues came after only a brief period of growth
200
180
160
140
120
100
80
60
40
20
0
40%
30%
20%
10%
0%
-10%
-20%
-30%
-40%
2002 2003 2004 2005 2006
Revenues – US$ billion
%Growth
2008 2009
2013
2012
2011
2010
2007
exchange rate over the year in question. For
this year’s edition of the YellowTable, a rate of
US$1= JPY97.63was used, whichputs theYen
some -22%weaker than the rate ofUS$ 1 = JPY
79.85 that prevailed just a year ago.
The weaker Yen has been a boon to Japanese
manufacturers’ exports over the last year.
Revenues in Yen terms rose for many as a result
in 2013. Komatsu’s revenues from construction
equipment sales in the 2013 calendar year were
JPY1,723billion, compared to JPY1,678billion
the previous year – a +2.3% increase.
However, there was a negative effect in
terms of the Yellow Table ranking in Dollars.
The company’s converted revenues fell from
Others 37.2%


