40
INTERNATIONAL AND SPECIALIZED TRANSPORT
■
NOVEMBER 2013
ICm20
While this year’s
IC
m20 ranking of the largest
crane manufacturers is up overall on 2012, it is
from a mixed bag of increases and decreases
around the world.
IC
reports
T
otal revenue for the world’s 20
largest crane manufacturers is
US$28.5 billion in
IC
’s unique
IC
m20 ranking by sales revenue. It is a
healthy enough increase of just over
5 % on the $27. 1 billion posted in 2012.
Instead of the clearer picture of a near
universal return to growth in last year’s
table, however, what characterises things
this year is fluctuation by geography.
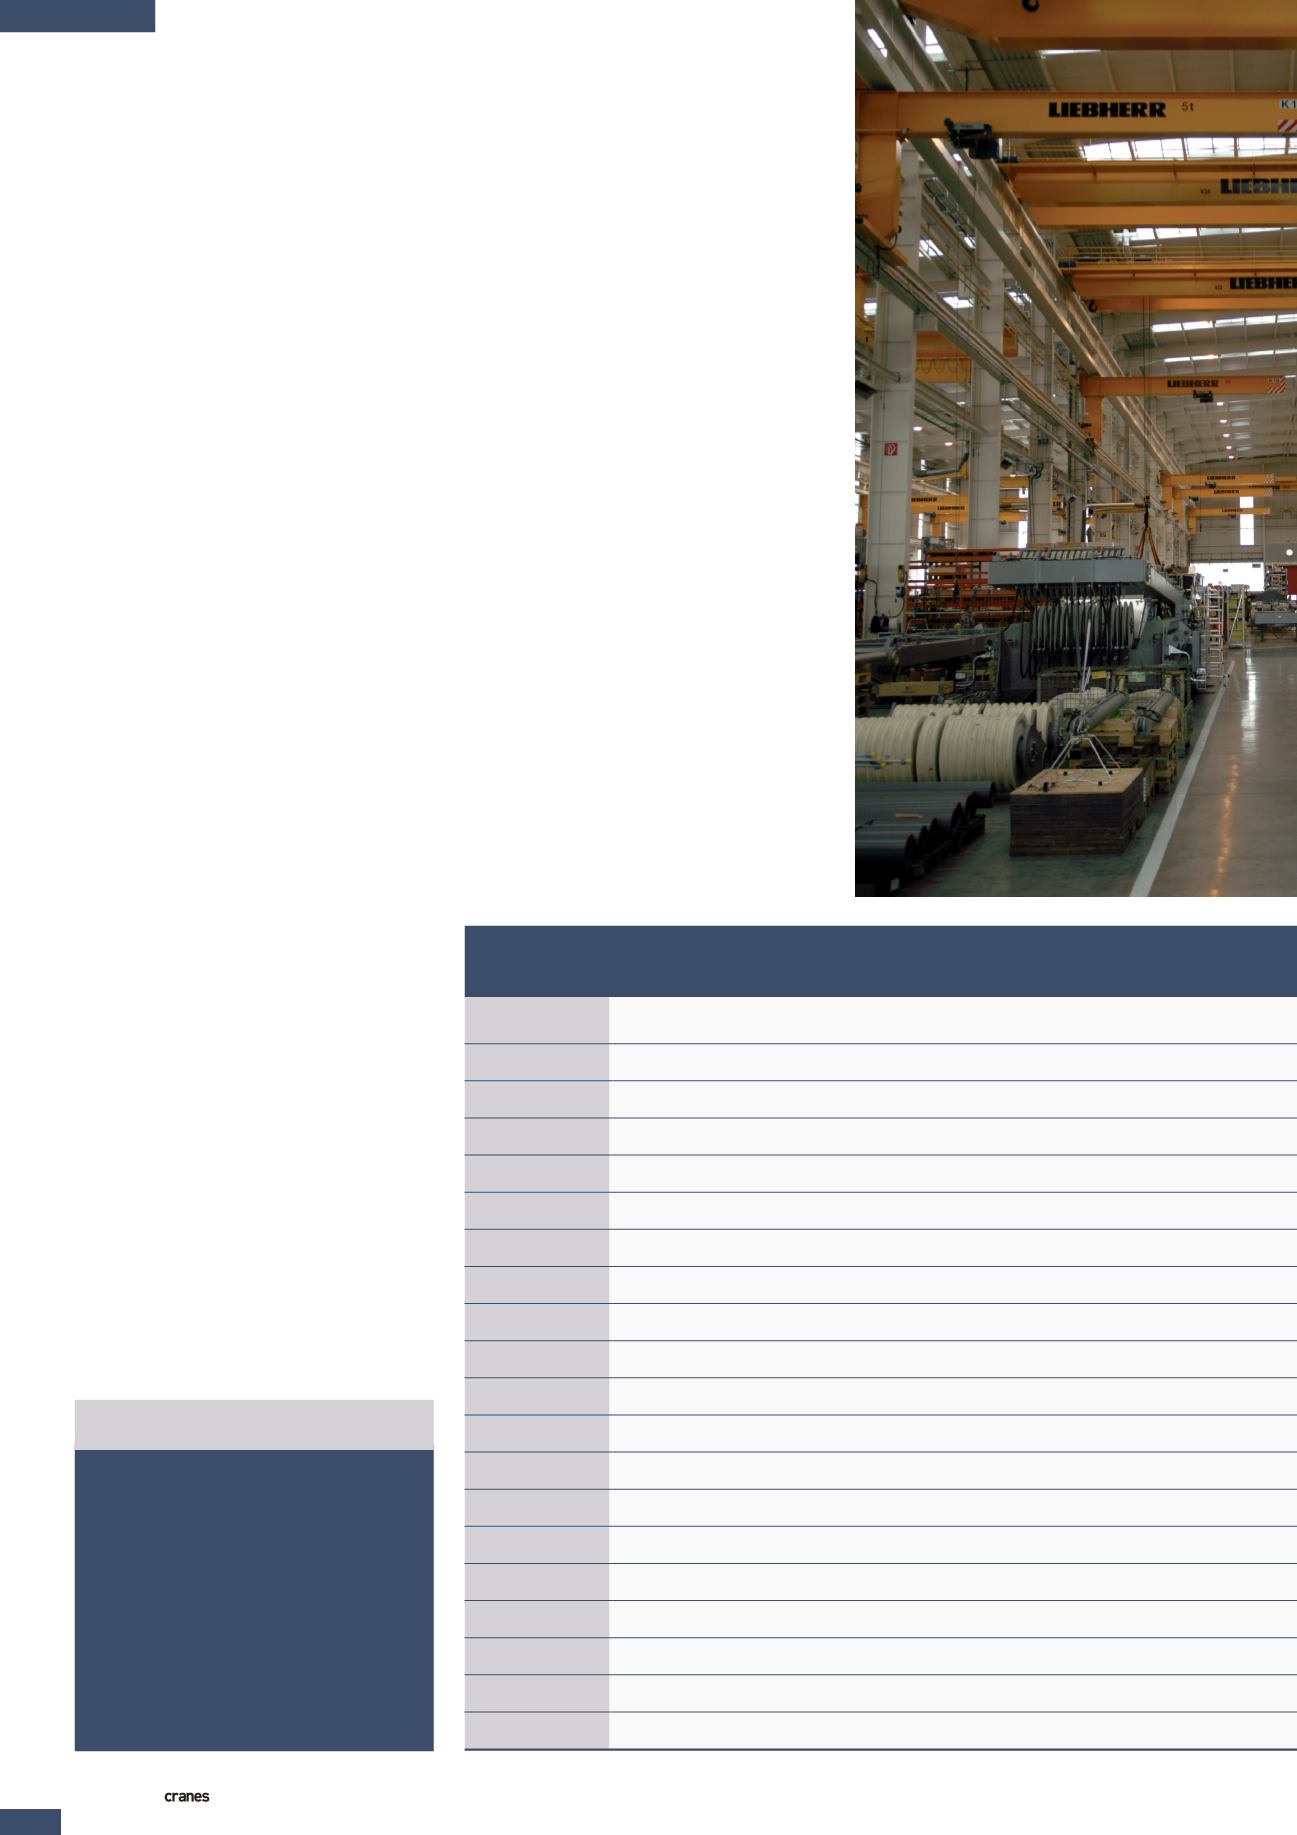
Liebherr retains its position at the top
of the table as the world’s largest crane
manufacturer by sales revenue. Growth
in its Euro reporting currency, without
exchange rate fluctuation, was more than
7 % on the year before. While Liebherr
is more than a billion dollars ahead of its
nearest rival, the lead is 15 % smaller than
it was last year.
Up in the USA
Standing out this year are manufacturers
with strong links to the USA. The second
place company in the table has changed
from Cargotec, which held that position
for several years, to Terex, which is up
one place. With an increase of more than
10 % Manitowoc gains two places to 5th.
Link-Belt, in particular, has also done very
well with a two place move up to 14th
on the back of a 30.4 % ($119 million)
rise in sales revenue. Manitex moves up
two places to enter the ranking at 20th,
with a huge 45 % rise largely driven
by growth in the US energy sector over
1
1
Liebherr
4,518
4,030
2
3
Terex Cranes
(including MHPS)
3,332
2,602
3
2
Cargotec
2,813
2,650
4
6
Konecranes
2,797
2,446
5
7
Manitowoc Cranes
2,441
2,200
6
5
Zoomlion
2,319
2,491
7
4
Xuzhou Heavy Machinery
(XCMG)
2,161
2,509
8
8
ZPMC
1,750
1,654
9
9
Tadano
1,362
1,446
10
10
Sany
871
917
11
14
Palfinger
758
545
12
11
Kato Works
745
729
13
13
Columbus McKinnon
597
592
14
16
Link-Belt
509
390
15
12
Kobelco Cranes Co
459
608
16
15
Sennebogen
415
410
17
17
Hitachi Sumitomo
281
343
18
20
Favelle Favco
(including Krøll)
219
158
19
19
Fuwa
189
203
20
22
Manitex
164
114
It should be noted that the percentage
change figures related to revenue are in the
reporting currencies and not calculated after
conversion into US dollars as shown in the
table as the table uses different exchange
rates each year – the one prevailing at the
time of writing, this year as follows:
€1 = US$1.35
US$1 = JPY 99
US$1 = CNY/RMB 6.1
US$1 = Malaysian Ringgit 3.2
NOTES ON THE ICm20
RANK
LIFTING SALES (US$ MILLION)
2013 2012
COMPANY
2012
2011
Ups and
downs


