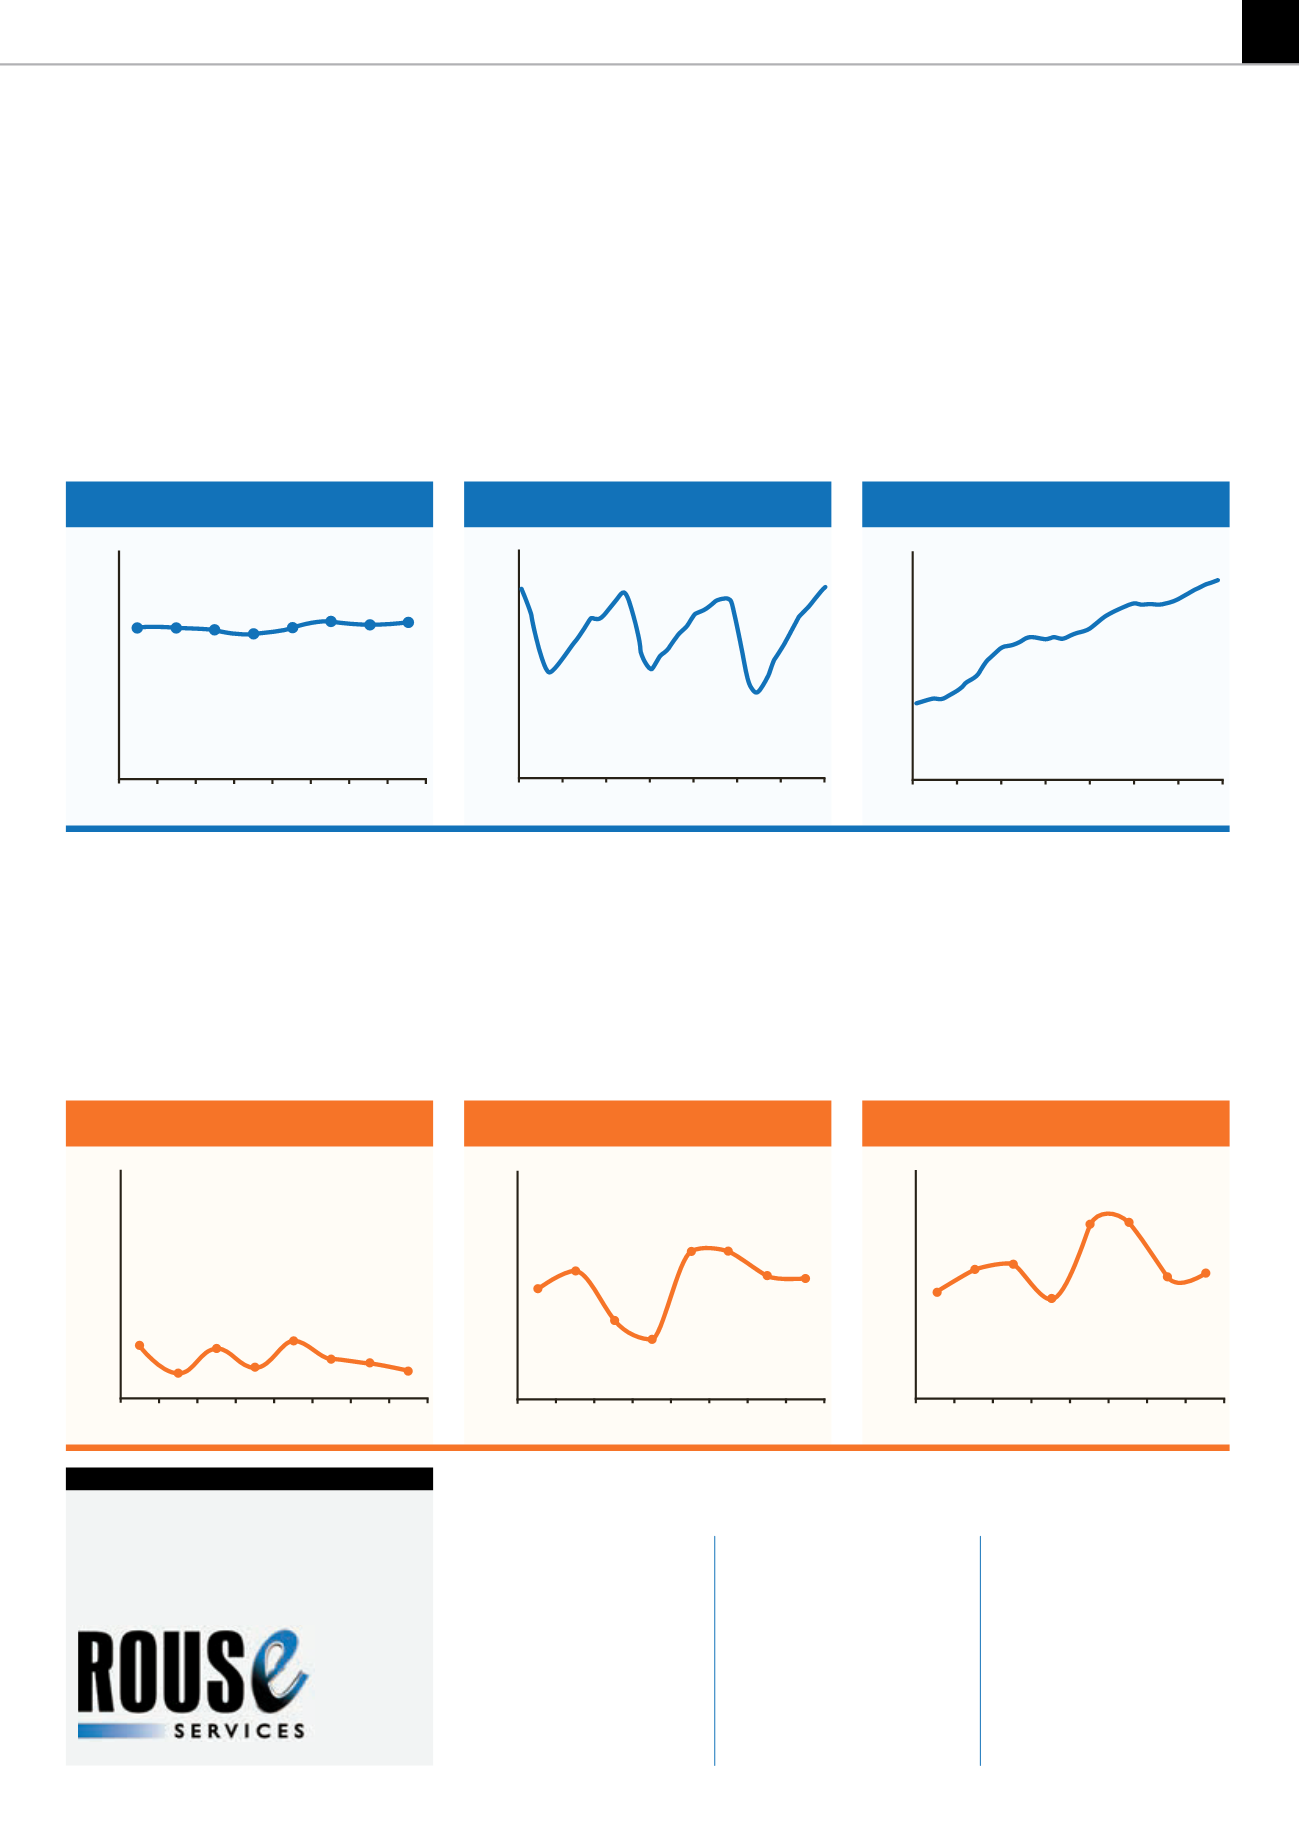
The fourth quarter 2014 Rouse Forced Liquidation Value Index (UK) for used equipment prices observed in
auctions taking place throughout the country decreased by 1.4%, from 48.9% in the third quarter to 48.2%
in the fourth. The index decreasedeachof the last four quarters, with values currently in-linewithQ4 2013.
Manyof themajor categories trackedbyRouseexperiencedquarter-on-quarter valuedeclines in the fourth
quarter - excavators (-7.5%), skid steer loaders (-6.4%) and air compressors (-5.1%). The wheeled loaders
category experienced the largest quarter-on-quarter increase at 11.7%. The value of UK construction output
increased approximately 10% in 2014 year-on-year. Growth in the value of UK construction output continues
tooutpace 2013, though at a slower pace in the secondhalf of 2014 compared to the first half of the year.
Equipmentvalues in theUS tickedupslightly in the fourthquarter2014, but remained relatively flat throughout
2014. Current Forced LiquidationValues aremore than45%higher than theprior troughperiod inmid-2009.
Aerial categories and compaction equipment have seen the biggest value improvement over the last 24
months, while certain earthmoving categories (excavators andwheeled loaders) have experienceddeclines.
Measuredby theRouseRate Index, US rental rates areup 26% throughSeptember 2014 relative to January
2011. Over this period, the generator and backhoe (35% through September 2014) categories have seen the
largest rental rate increases, while aerial categories have experienced increases from 21% to 26%. Physical
utilisation, which is seasonal, has remained steady, thoughon larger fleet sizes today than inJanuary2011.
Theyear indetail
Last year was characterised
by stability in the US and a
decliningUKmarket as far
as equipment valueswere
concerned. RouseServices
provides the details.
39
ROUSEMETRICS
IRN JANUARY-FEBRUARY 2105
US-basedRouseServices is a leader in
constructionequipment appraisals, used
equipment sales support and fleetmanagement
analytics, specialising in the rental sector. For
more informationgo towww.rouseservices.com
ROUSEFORCEDLIQUIDATION
VALUE INDEX (US)
PHYSICALUTILISATION
75%
70%
65%
60%
55%
50%
FLV INDEX
Oct
2011
Mar
2012
Aug
2012
Jan
2013
June
2013
Nov
2013
Apr
2014
Sept
2014
DOZERS INDEX (FLV)
70%
65%
60%
55%
50%
45%
FLV INDEX
TELEHANDLERS INDEX (FLV)
70%
65%
60%
55%
50%
45%
FLV INDEX
Q1
2013
Q1
2013
Q1
2013
Q3
2013
Q2
2013
Q3
2013
Q2
2013
Q3
2013
Q2
2013
Q1
2014
Q4
2013
Q1
2014
Q4
2013
Q1
2014
Q4
2013
Q4
2014
Q3
2014
Q2
2014
Q4
2014
Q3
2014
Q2
2014
Q4
2014
Q3
2014
Q2
2014
ROUSERATE INDEX
1.30
1.25
1.20
1.15
1.10
1.05
1.00
0.95
1.26
Oct
2011
Aug
2012
June
2013
Apr
2014
Sept
2014
Mar
2012
Jan
2013
Nov
2013
UKmarket metrics
USmarket metrics
ROUSEFORCEDLIQUIDATION
VALUE INDEX (UK)
70%
65%
60%
55%
50%
45%
FLV INDEX
Definitions:
Rouse Forced Liquidation
Value Index
Theaverageauction (Forced
LiquidationValue) recoveries
expressedasapercentageof
Original Equipment Cost.
Forced LiquidationValue (FLV)
Theestimatedgrossamount
expressed in termsofmoney
that equipmentwill typically
realiseat aproperly conducted
publicauctionwhen the seller is
compelled to sell asof a specific
datewithinanapproximatelyone
monthperiod.
Rouse Rate Index
Achieved rental rates relative
toJanuary2011 (whenRouse
Analytics started tracking rate
data) for abasket of commonly
rented items.
Physical Utilisation
Thepercentageof fleet cost
which ison-rent duringagiven
period. Aunit is “on-rent” if it
isat a jobsiteearning rental
revenue.
Q1
2013
Q3
2013
Q2
2013
Q1
2014
Q4
2013
Q4
2014
Q3
2014
Q2
2014
70%
65%
60%
55%
50%
45%
FLV INDEX


