IRN JANUARY-FEBRUARY 2015
14
ERA/
IRN
RENTALTRACKER
¼
Worse
Same
»
Better
Balanceof opinion
Q4-14
+29.5%
»
42.8%
43.8%
¼
13.4%
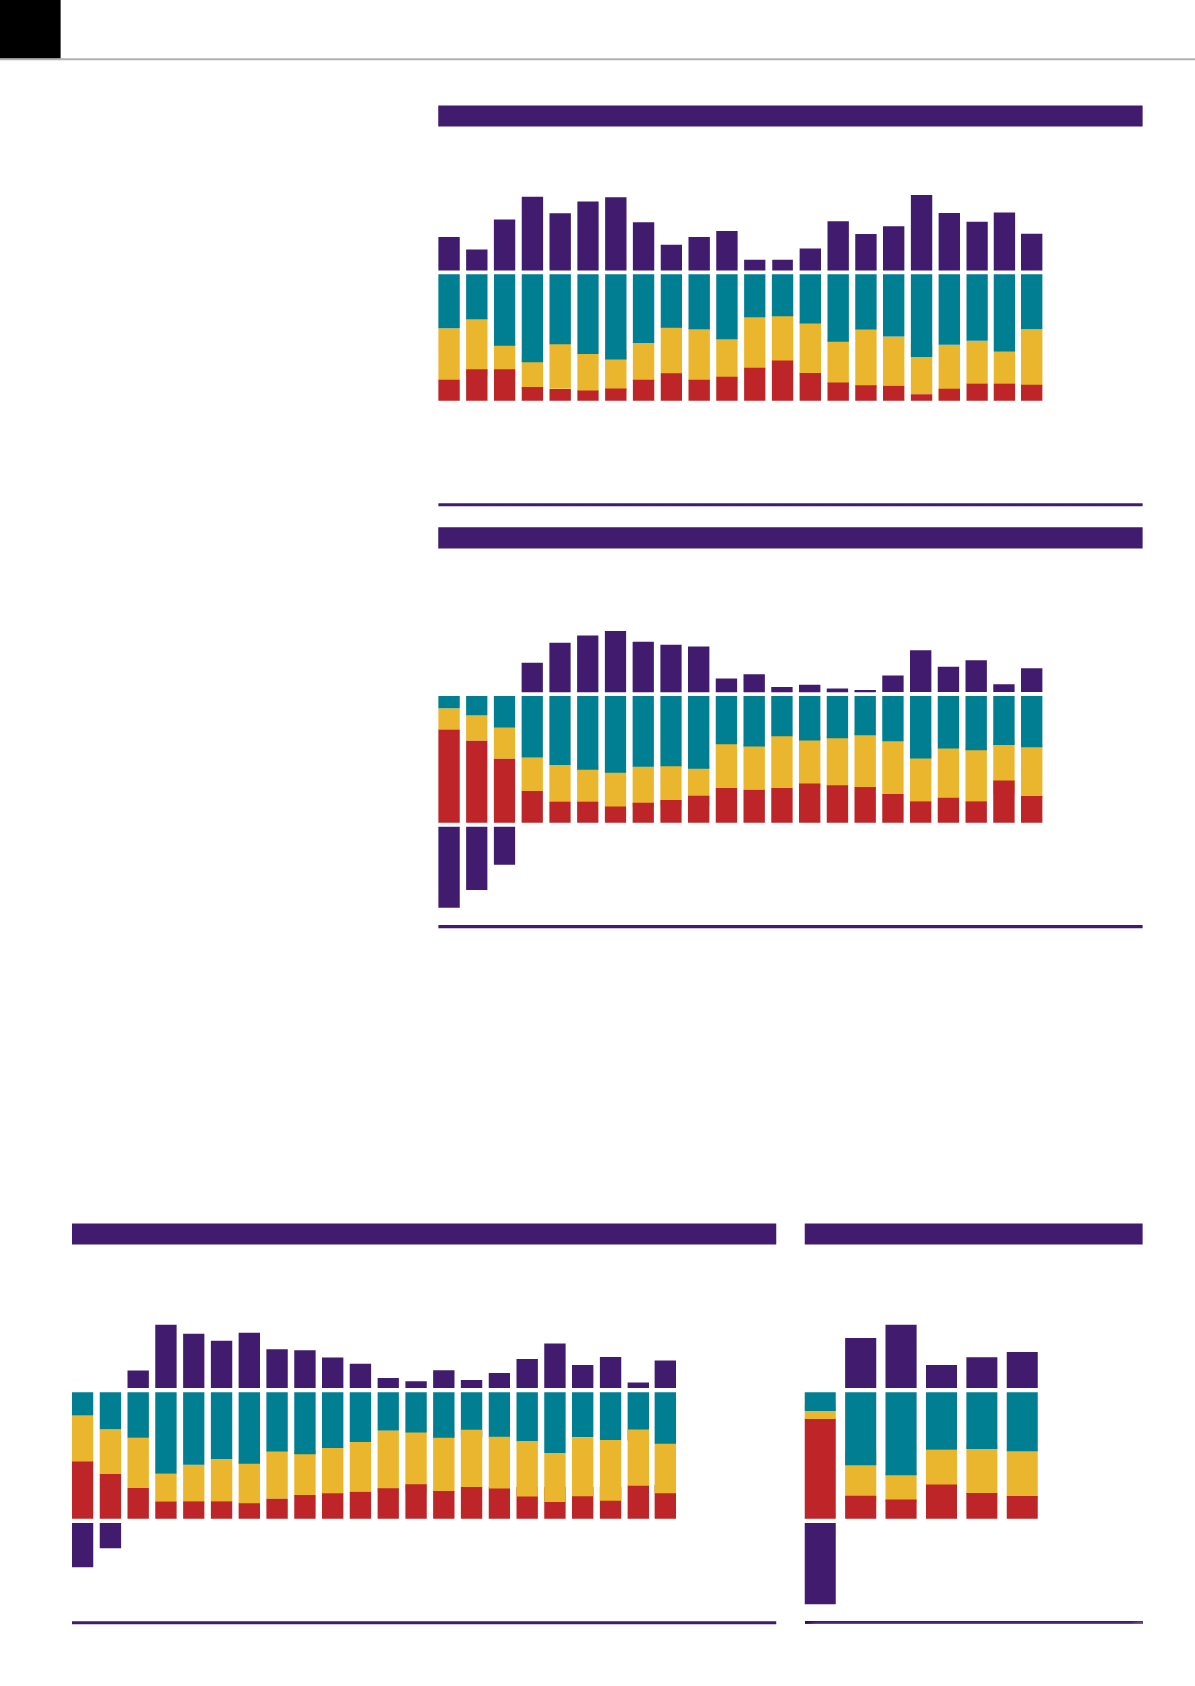
FIGURE 2
Europe: Expectations foryear fromnow
Q3/09
Q4/09
Q1/10
Q1/11
Q1/12
Q1/13
Q1/14
Q3/10
Q3/11
Q3/12
Q3/13
Q2/10
Q2/11
Q2/12
Q2/13
Q3/14
Q4/14
Q2/14
Q4/10
Q4/11
Q4/12
Q4/13
¼
Lower
Same
»
Higher
Balanceof opinion
Q4-14
+18.8%
»
40.2%
38.4%
¼
21.4%
FIGURE 3
Europe: Quarterlyactivityyear-on-year
Q3/09
Q4/09
Q1/10
Q1/11
Q1/12
Q1/13
Q1/14
Q3/10
Q3/11
Q3/12
Q3/13
Q2/10
Q2/11
Q2/12
Q2/13
Q3/14
Q2/14
Q2/14
Q4/10
Q4/11
Q4/12
Q4/13
-62%, also scored the lowest balance of opinion on
current business conditions in the fourth quarter –
deeper than the balance of -40% seen in the third
quarter.
Investment
Meanwhile, therewere some strong gainers when it
came to investment sentiment – topping the table
of respondents expecting to increase investment by
over 10% in 2015 were Nordic companies, with 80%
stating that this was the case, a big rise compared
to the 38% in the thirdquarter.
TheUK came secondon thisquestion, with48%of
respondents planningonupping investment byover
10% in 2015 (after the higher levels of investment
already seen in 2014), while the European average
stood at 31%. Nevertheless, the overall positive
balance of respondents expecting to increase fleet
investment in 2015 stood at +10.6% – this is actually
its lowest level since the thirdquarter of 2013.
Looking at forecasts for 12 months’ time, the
most upbeat set of respondents came once again
from the UK, with 82% forecasting business to be
better or much better a year down the line. This
represented an improvement on last quarter’s 64%.
Nordic, Italian and German respondents also beat
the European average for this metric, which stood
at 43% for the fourth quarter, down slightly from
45% in the last survey.
Respondents from Southern European companies
also registered more positive sentiment than in
previous surveys. Spain and Italy reported some
improvements in the fourth quarter, particularly in
time utilisation trends (Spain) and forecasts for 12
months ahead (Spain and Italy).
However, the sample size for Spain remains
stubbornly low, so Spanish results should be
treatedwithadegreeof caution. And, of course, any
improvement in Spain and Italy has to be viewed in
the context of a downbeat wider economy.
Overall for Europe, the balance of opinion (the
difference in the proportions of respondents seeing
positive and negative trends) on time utilisation
stood at +22% at the end of the fourth quarter, a
big jump compared to the+3.2% thatwas registered
in the last survey, and the second highest level for
2014 as awhole.
Strong sentiment from Germany and the UK
skewed thismetric somewhat, with83%of Germany
respondents reporting increasing utilisation in the
fourthquarter, and81%of UK companies.
Employment intentions also recovered compared
to the downbeat third quarter, with an overall
balance of +14.6 of respondents saying they
expected to increase their number of employees in
the next quarter. However, thiswas still the second-
lowest balance of opinion on this question for the
year 2014 as awhole.
Russia
The fourth quarter survey also attracted enough
respondents from Russian rental companies to
warrant inclusion – albeit still a small sample that
should be treated with caution. When it came to
current business conditions, the balance of opinion
evened out at 0%, with asmany Russian companies
feeling conditionswere improving as those that felt
theywere deteriorating.
On other questions, 17% of Russian companies
reported year-on-year growth in the fourth quarter,
16% said fleet utilisation was increasing, 80% said
they would employ more staff in the next quarter,
50% felt business conditions would improve in
12 months’ time and 20% said they expected to
increase fleet capital expenditure by over 20% in
2015.
FIGURE5
Europe: Full-year
2009
2010
2011
2012
2013
2014
Q4-14
+28.8%
»
46.8%
35.2%
¼
18.0%
¼
Deteriorating
Same
»
Improving
Balanceof opinion
Q4-14
21.6%
»
41.2%
39.2%
¼
19.6%
FIGURE4
Europe: Timeutilisation trend
Q3/09
Q4
/09
Q1/10
Q1/11
Q1/12
Q1/13
Q1/14
Q3/10
Q3/11
Q3/12
Q3/13
Q2/10
Q2/11
Q2/12
Q2/13
Q3/14
Q4/14
Q2/14
Q4/10
Q4/11
Q4/12
Q4/13
NOTE:
Activity level compared toprevious year.


