9
d
&
ri
MAY-JUNE 2014
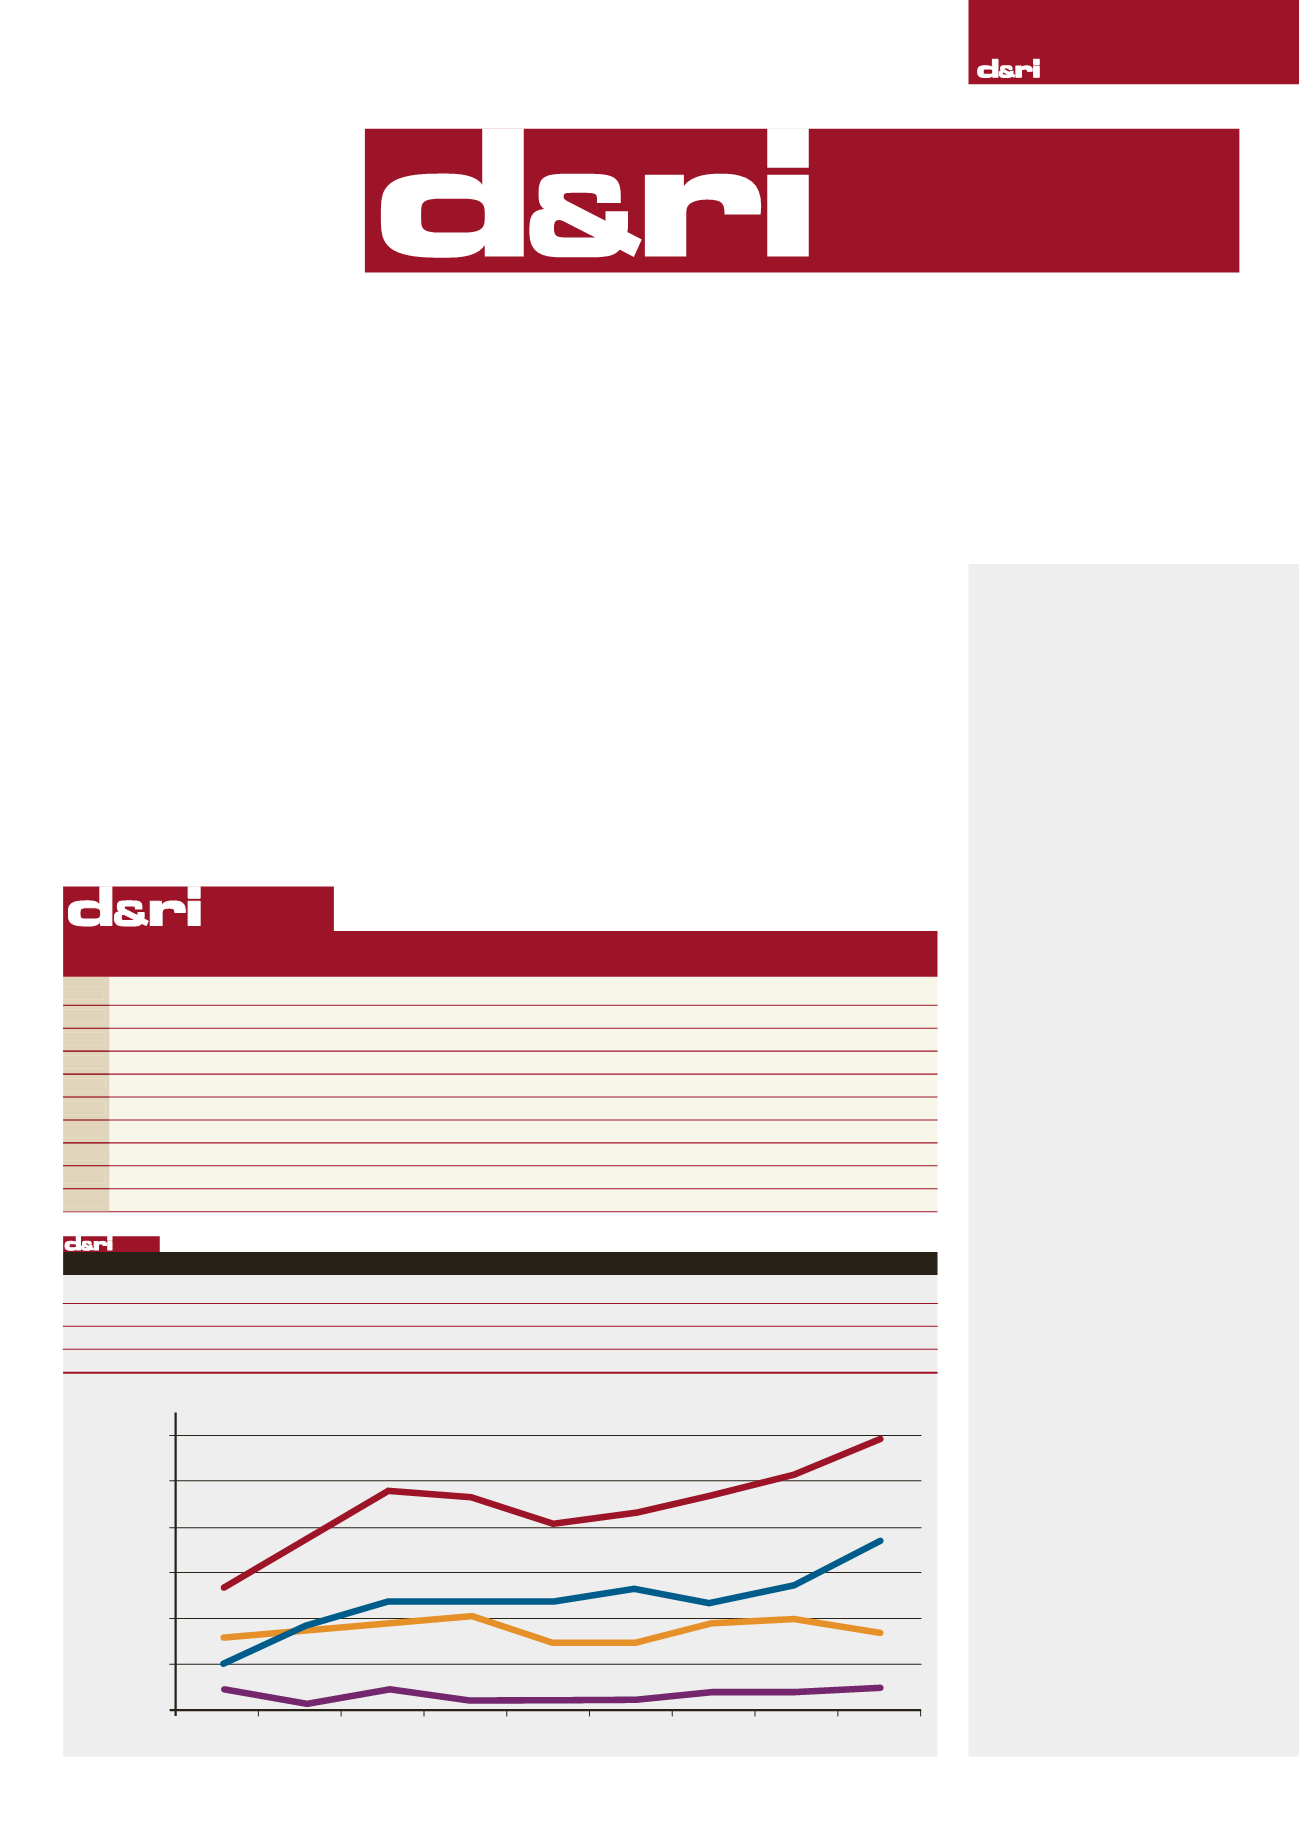
100
2006 2007 2008 2009 2010 2011 2012 2013 2014
d
&
ri
100
2,701.60 3,688.80 4,781.20 4,625.40 4,069.40 4,337.90 4,680.40 5,106.10
5,995.00
Americas
1,571.60 1,733.80 1,912.50 2,030.60 1,439.00 1,454.80 1,938.10 1,991.40
1,690.40
Europe
1,082.40 1,844.40 2,390.10 2,377.50 2,391.30 2,627.70 2,371.40 2,707.60
3,772.00
RoW
486.00 110.60 478.60 217.30 228.90 255.40 366.30 407.10
528.60
The top of
D&Ri’s
ranking of the world’s
largest demolition
companies has in the
past been dominated
by American
contractors, but this
year’s list sees a shift
of power from that
continent to Europe.
LINDSAY GALE
reports on the ups
and the downs of the
industry
T
he surprising news
contained in this year’s
d
&
ri
100
is that the
dominant hold that the American
industry has historically had on
the top spots has finally been
broken by European contractors
in 2013. The top four positions
were all held by US contractors
last year, with the top 10 made up
of five from that continent, four
from Europe and one Australian
contractor. This year, the position
is very different, with only two
US companies in the top ten, with
The balance
shifts
100
100
100
seven coming from the European
continent and an Australian outfit
again rounding out the top 10.
And the top two slots have now
gone to European contractors
with the highest placed US
contractor coming in at number
three.
At this point, I would add the
usual
caveat
– in many cases, it is
virtually impossible to separate
out the core demolition and
associated recycling activities
from the general turnover figures
available to us. Many contractors,
Sourcing
the data
As was the case last year,
considerable resources
were devoted to encourage
contractors around the
world to supply basic
financial data concerning
their activities during 2013.
Where we were unable to
obtain information from
companies themselves,
independent financial
reporting services were
consulted to obtain the
necessary data.
D&Ri
never
makes use of even informed
estimates in the compilation
of the
d
&
ri
100
.
I have endeavoured to
ensure the accuracy of the
figures used in the creation
of the
d
&
ri
100
ranking
of the world’s top demolition
companies but KHL can
accept no liability for any
errors or inaccuracies
relating to the individual
turnover figures contained in
this report.
I would like to encourage
all companies that receive
future requests for data for
the
d
&
ri
100
to respond,
as the greater the level of
response from contractors
around the world, the more
accurate and comprehensive
future listings will be.
Currency
conversion
Data that was supplied to
d
&
ri
in currencies other
than the US Dollar were
converted using the relevant
exchange rates as of 2nd
May 2014.
1
(28)
PSG - International AS
Zin
CZECH REPUBLIC
72.80
347.00
2
(5)
AF Decom AS
Etterstad
NORWAY
135.00
243.00
3
(2)
NCM Group
Snoqualmie
USA
222.10
240.00
4
(6)
Keltbray Ltd
Esher
UK
140.00
236.50
5
(19)
CMA Corporation
Sydney
AUSTRALIA
89.90
220.90
6
(4)
Brandenburg Industrial Services Co
Chicago
USA
180.00
189.80
7
(
NEW
)
Wanty SA
Binche
BELGIUM
184.40
8
(37)
Eurovia Beton GmbH
Magdeburg
GERMANY
52.00
168.00
9
(9)
McGee Group Ltd
London
UK
84.00
156.90
10
(8)
Beelen Sloopwerken BV
Harderwijk
NETHERLANDS
87.50
149.70
YEAR ON YEAR
6,000.00
5,000.00
4,000.00
3,000.00
2,000.00
1,000.00
0
US$ M
2006 2007 2008 2009 2010 2011 2012 2013 2014
POSITION
TURNOVER (US$)
14
(13)
COMPANY NAME
LOCATION
2012
2013


