international
construction
april 2015
16
Yellow Table
NEWSREPORT
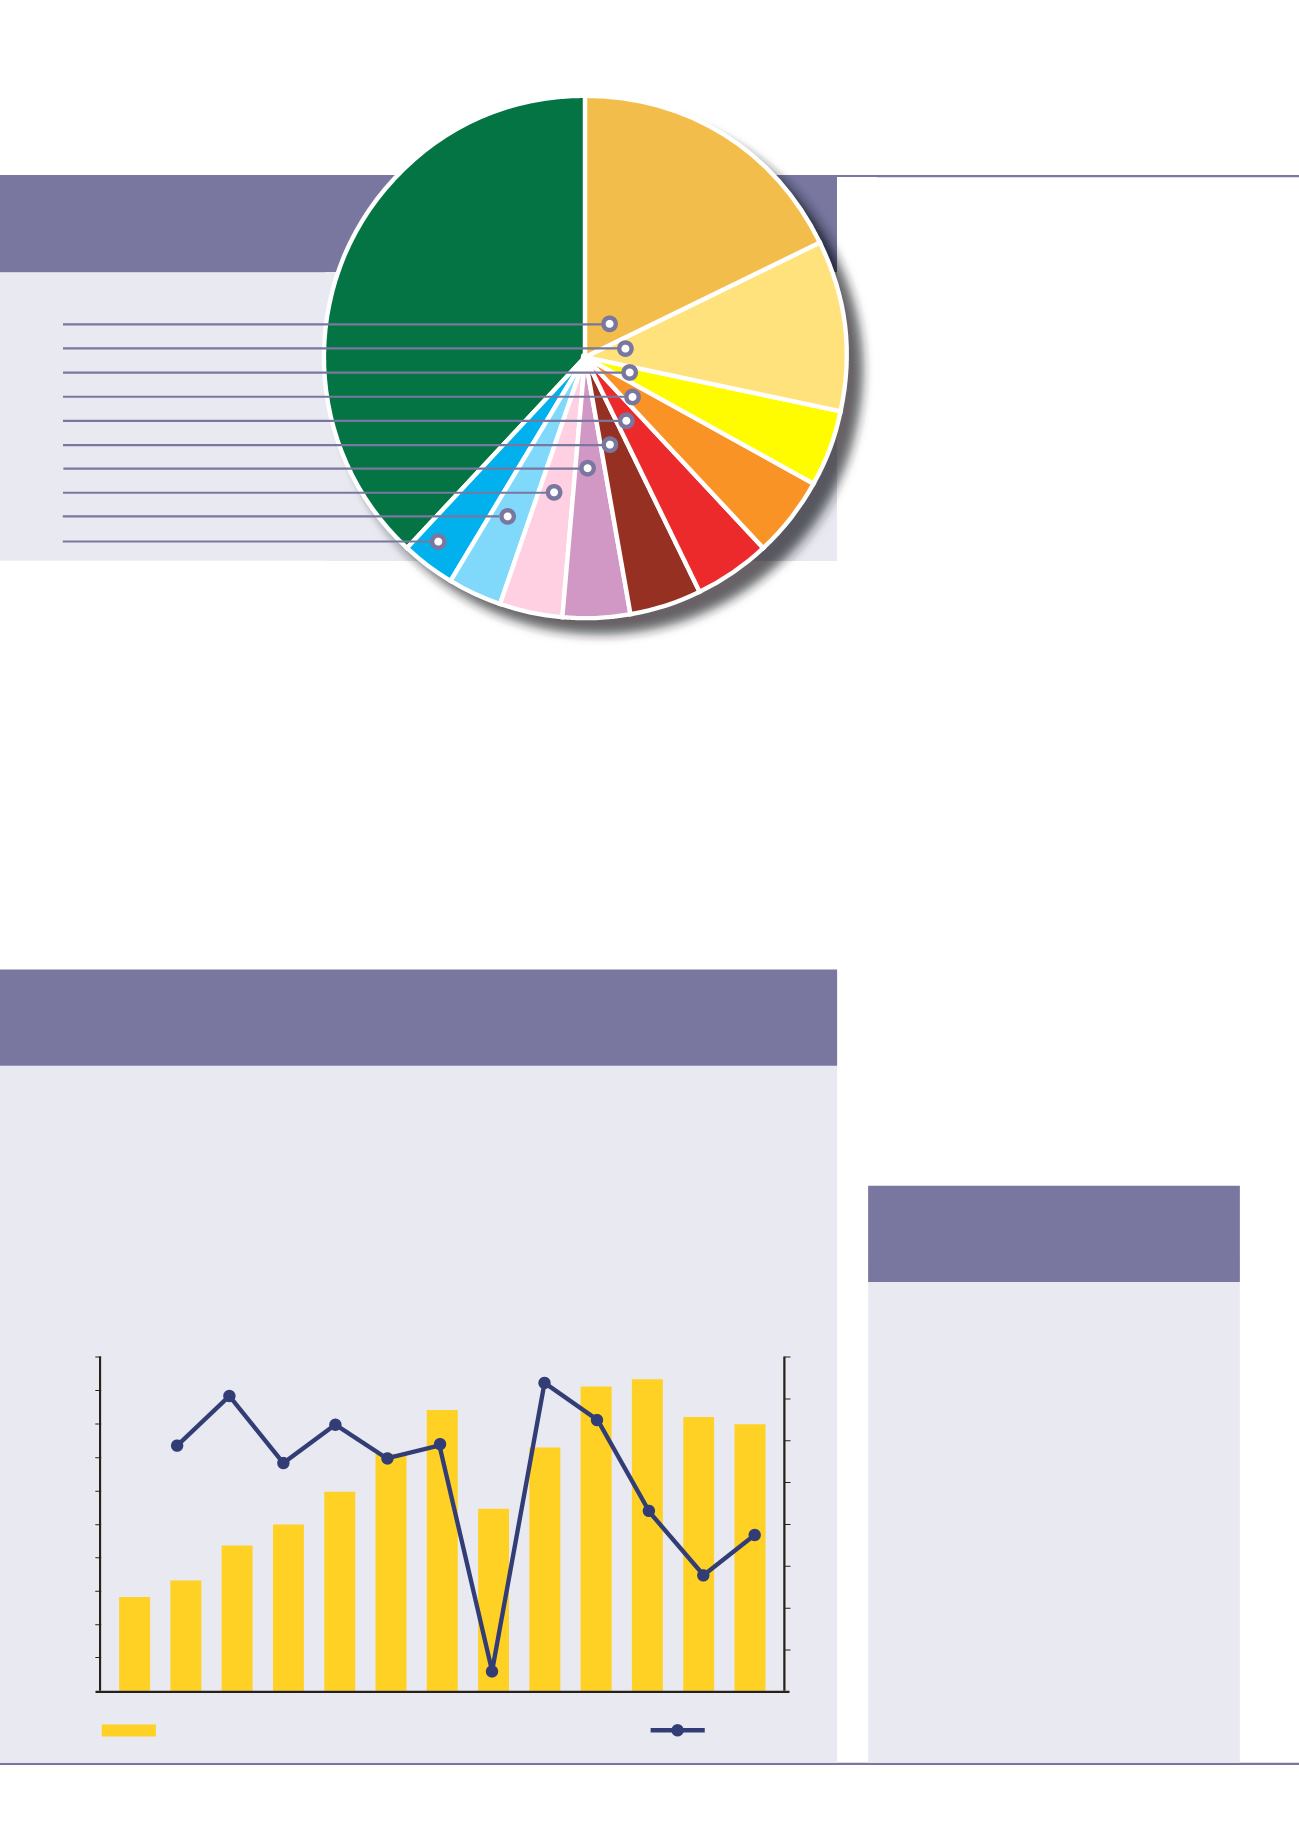
Top 10
Company shares
Positions in the YellowTable are based on sales in
the2014 calendar year inUSDollars. Currencies
have been converted toDollars based on the
average exchange rate over the course of 2014.
Datawas gathered from a variety of sources
including audited accounts, company statements
and reputable third-party sources.
In Japan, India and certain other countries, the
use of the fiscal year (endingMarch31
st
) hasmade
it impossible to establish calendar year information.
In these cases, fiscal year resultswere used. In
some cases
iC
hasmade an estimate of revenues
based onhistorical data and industry trends.While
every effort has been taken to ensure information
in this report is accurate,
iC
does not accept any
liability for errors or omissions.
If youwould like to comment on the YellowTable,
or feel your company shouldbe included, please
e-mail the editor at
Methodology
these countries. In mature markets, that tends
to mean compact equipment and machines
like telehandlers and access platforms. They are
countries where there tends to be a focus on
renovation in the construction industry, rather
than new-build and large infrastructure projects,
which favour heavier equipment
In contrast, emerging markets tend to be
more focussed on earthmoving machines for
the opposite reasons. In addition, in mature
economies compact equipment tends to replace
manual labour but in emerging countries, lower
labour costs tend tomean this does not happen.
Another point here is that the downturn in
emerging markets last year seems to have had a
particular impact on crane manufacturers in the
Yellow Table. Big names like Manitowoc and
Liebherr have slipped a place in the standings,
and Terex Cranes’ revenues were also down,
althoughTerex as awhole didwell thanks inpart
toGenie’s contribution.
But undoubtedly, the big negative last year was
the continued weakness in the global mining
equipment market, driven by low commodity
prices.This is tied to emergingmarket weakness,
asmanycountries indevelopingpartsof theworld
relyon extracting and exporting rawmaterials for
their economic growth.
The downturn in mining can be seen in the
Yellow Table among companies which are
particularly exposed to this sector. As previously
mentioned, Caterpillar is one, but others clearly
suffering included Bell Equipment and Boart
Longyear.
For other manufacturers, the downturn in
mining is wrapped up in the broader results.
There is a grey area betweenwhat is construction
equipment andwhat ismining equipment. Large
construction projects may use machines more
typically found in mines, while small mineral
operations might purchase small construction-
sized equipment.
So the impact is hard to discern for certain,
but many manufacturers say the downturn in
global mining is having an impact on financial
performance.
Outlook
So if the industry is to return to growth, the key
ingredients would seem to be an improvement in
emerging constructionmarkets, and a rebound in
commodity prices.Timewill tell as ever.
iC
■
Caterpillar 17.8%
■
Komatsu 10.6%
■
Hitachi 4.9%
■
Volvo 4.9%
■
Terex 4.6%
■
Liebherr 4.5%
■
JohnDeere 4.1%
■
XCMG 3.9%
■
Sany 3.4%
■
Doosan 3.4%
L
ast year saw revenues for theworld’s top 50 construction equipmentmakers fall -2.6%, compared
to the -12.2% drop of 2013. The decelerationmight suggest that the industry is about to come out
of a down-cycle and return to growth.
Following the initial rebound from the crisis years in2010–2012, it is fair to say the industry has
struggled. Therewas somewarning of this in2012, withgrowthprettymuchflat compared to the previous
year, and that was of course followedby 2013’s sharpdownturn. Revenueswere down again last year, but
the dropwas onlymoderate inpercentage terms.
Last year seems to have been about continued robust demand in theUS, while Europe finally returned to
growth. At the same time,many emergingmarkets –most notablyChina– clearly struggled.
Equipment industry cycles
Last year saw the globalmarket decline slow
200
180
160
140
120
100
80
60
40
20
0
40%
30%
20%
10%
0%
-10%
-20%
-30%
-40%
2002 2003 2004 2005 2006
Revenues – US$ billion
%Growth
2008 2009
2013 2014
2012
2011
2010
2007
Drivers
So what happened in the world last year, to see
these companies move up and down the Yellow
Table theway they did?
First of all, data from other sources suggests the
goodmarkets last year wereNorthAmerica, with
its continued growth, and Europe, which saw a
reasonable bounce-back inpercentage terms after
several grim years.
These trends tended to favourUS andEuropean
manufacturers.Companies aregenerally strongest
in their home markets, and are the ones set to
gain themost from a domestic up-turn.
However, there are also benefits for companies
making the types of equipment favoured in
Others 37.9%


